SARASOTA – Looking at the candy that comes in after trick or treating is always a thrill, because there is usually something good in there to steal from your children.
Another reason why we like to look at what comes in is to figure out how candy companies are doing for market share. This year, we at BrandlandUSA decided to add it up.
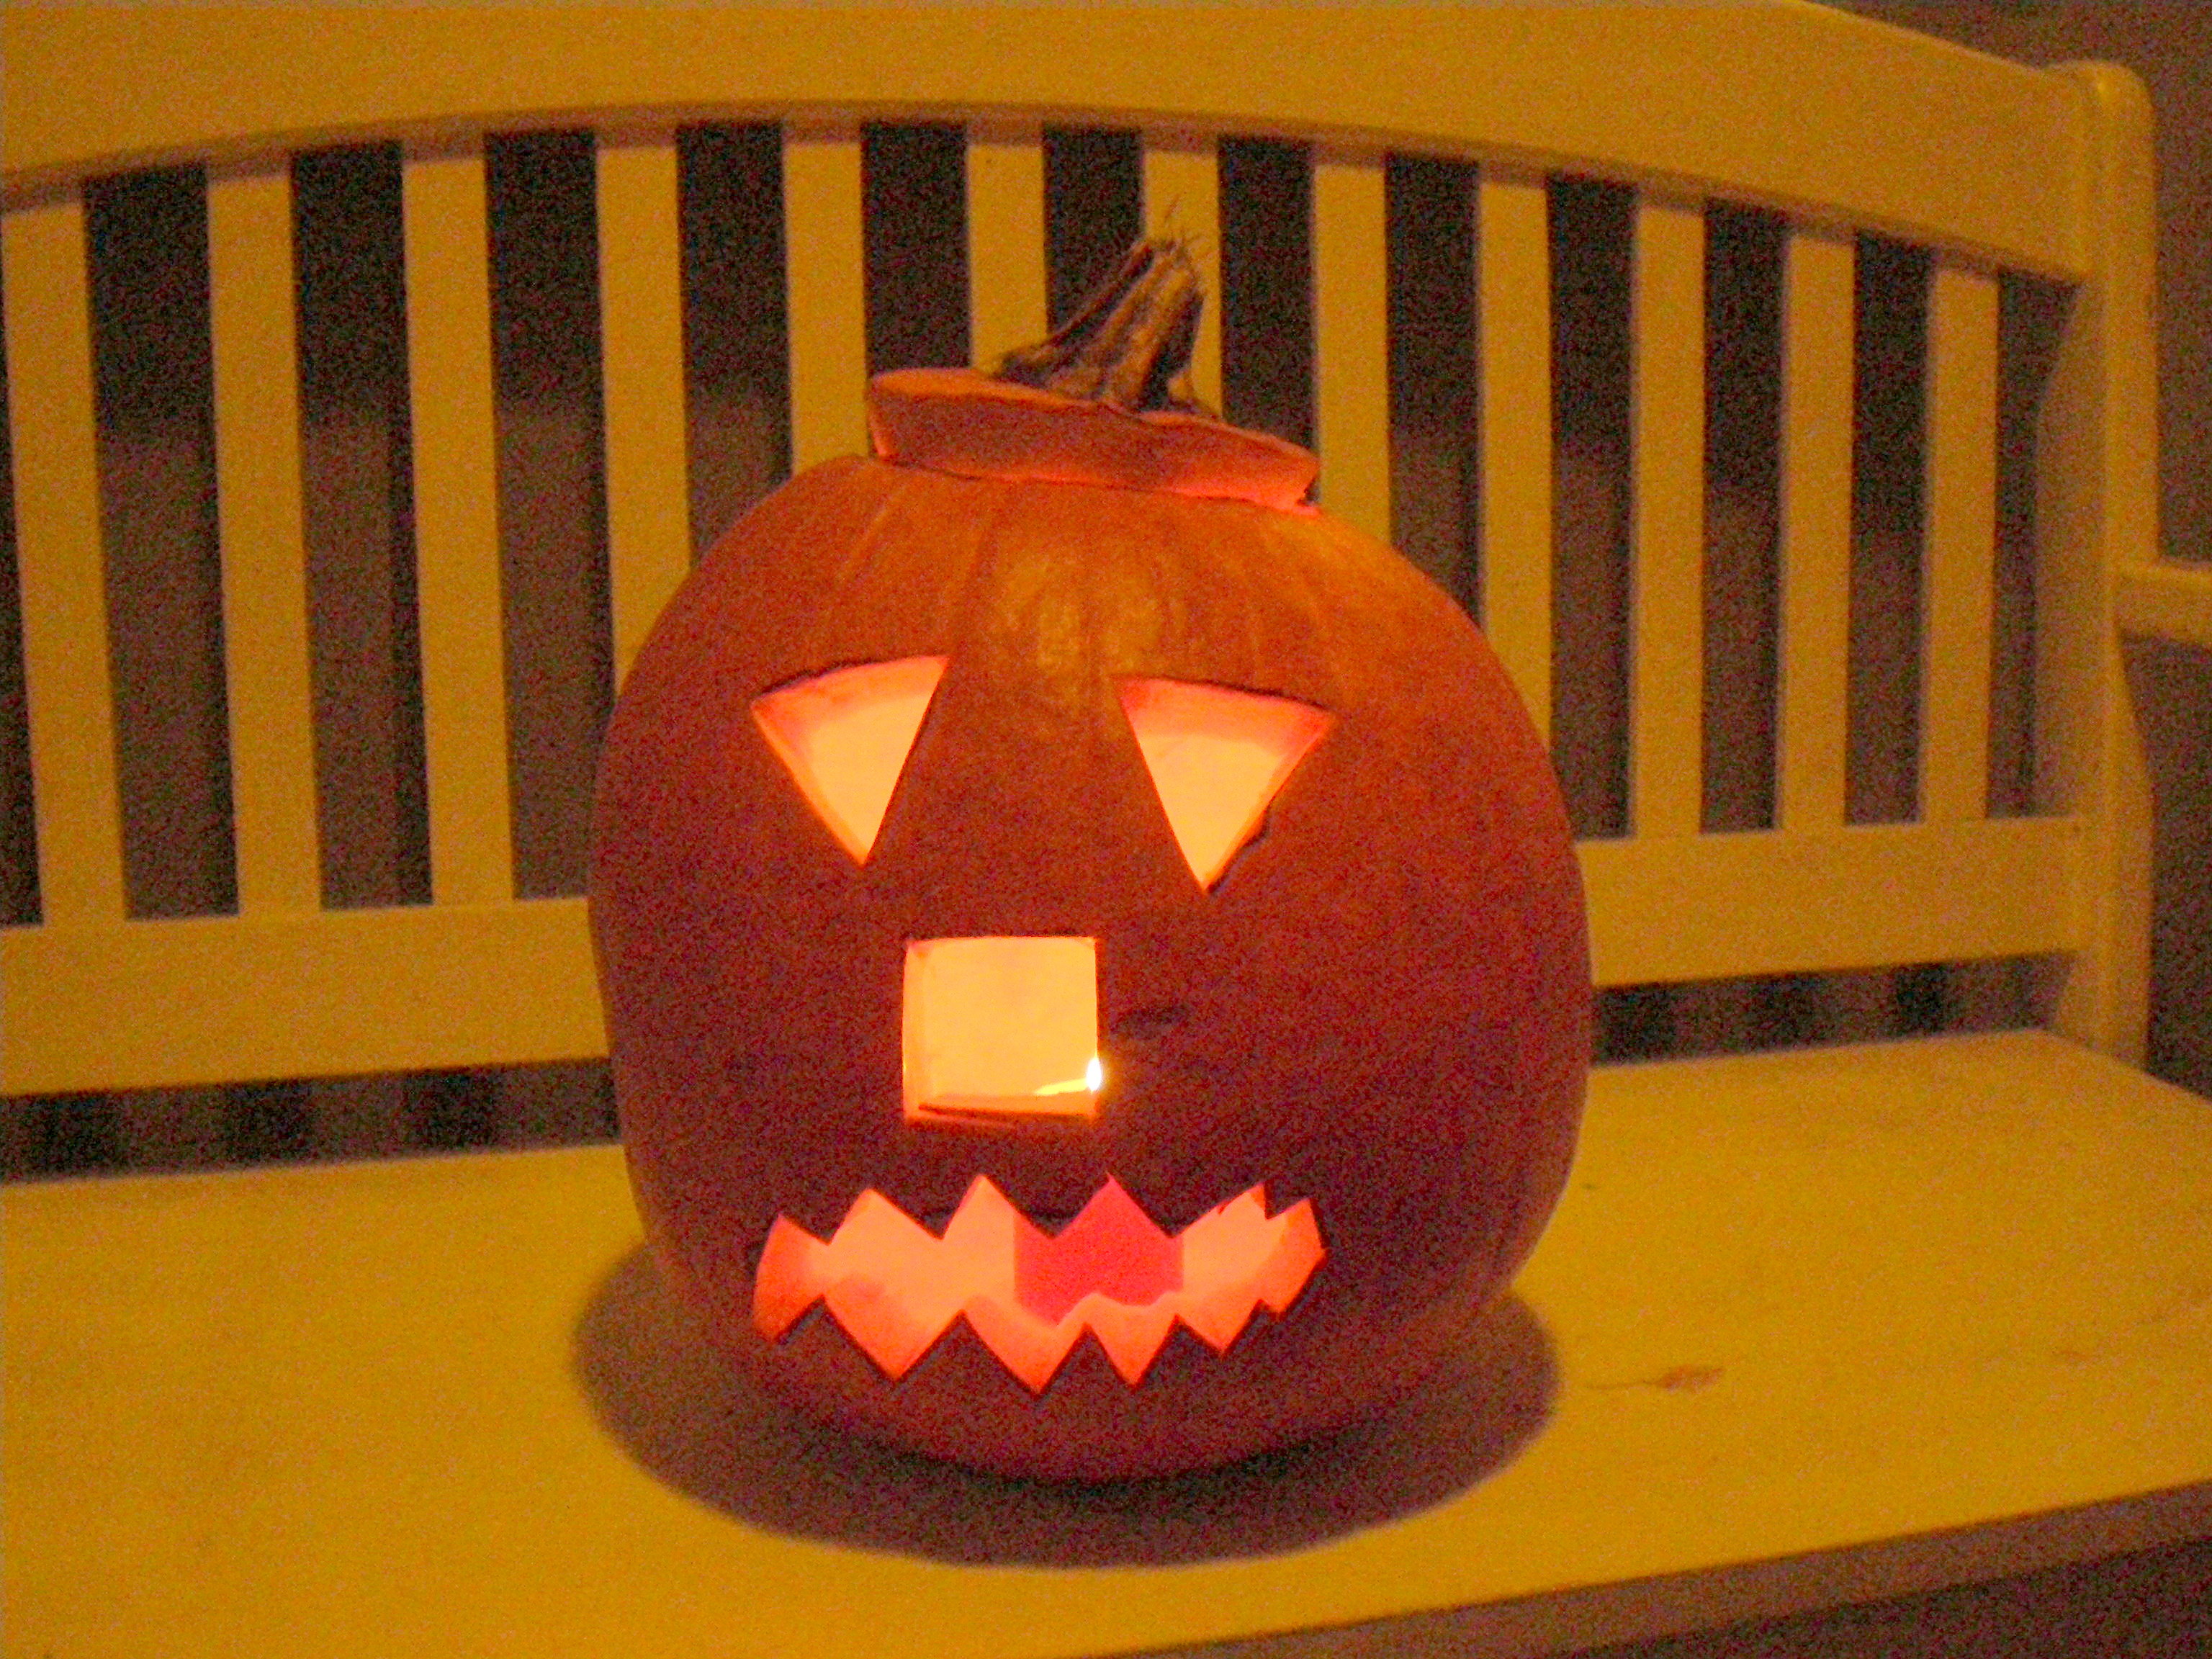
We took a highly unscientific sample of candy, namely about 45 pieces that remained from a 4-year-old’s pumpkin. We could assume that some of the good stuff (namely Milky Way and Hershey bars) had been removed. But we could also assume that the remainder had been well pillaged by a number of demographic groups, including teens and adults. So we didn’t feel the need to weight the results, though the numbers are probably screwed up somewhere. For instance, all the Reese’s disappeared (yours truly and others) but so did many of the Wonka Runts.
So what was the breakdown? Nestle was the winner, not only for its chocolates but its lineup of Wonka candies. Here is the list:
J. Garland Pollard IV is editor/publisher of BrandlandUSA. Since 2006, the website BrandlandUSA.com has chronicled the history and business of America’s great brands.
 SARASOTA – Looking at the candy that comes in after trick or treating is always a thrill, because there is usually something good in there to steal from your children.